K均值聚类和DBSCAN介绍
时间:2021-07-01 10:21:17
帮助过:25人阅读
numpy
def MyDBSCAN(D, eps, MinPts):
"""
Cluster the dataset `D` using the DBSCAN algorithm.
It will return a list of cluster labels. The label -1 means noise, and then
the clusters are numbered starting from 1.
"""
labels = [0]*len(D)
#Initially all labels are 0, 0 means the point hasn‘t been considered yet
C = 0
#C is the ID of the current cluster.
### This outer loop is just responsible for picking new seed points--a point
### from which to grow a new cluster.
for P
in range(0, len(D)):
if not (labels[P] == 0):
continue
NeighborPts = regionQuery(D, P, eps)
#Find all of P‘s neighboring points.
if len(NeighborPts) <
MinPts:
labels[P] = -1
else:
C += 1
labels[P] = C
#the label to our seed point.
growCluster(D, labels, P, C, eps, MinPts)
#Grow the cluster from the seed point.
return labels
def growCluster(D, labels, P, C, eps, MinPts):
"""
Grow a new cluster with label `C` from the seed point `P`.
This function searches through the dataset to find all points that belong
to this new cluster. When this function returns, cluster `C` is complete.
"""
### SearchQueue is a FIFO queue of points to evaluate. It will only ever
### contain points which belong to cluster C
SearchQueue =
[P]
i =
0
while i <
len(SearchQueue):
P =
SearchQueue[i]
NeighborPts = regionQuery(D, P, eps)
#Find all the neighbors of P
### If the number of neighbors is below the minimum, then
### move to the next point in the queue.
if len(NeighborPts) <
MinPts:
i += 1
continue
### Otherwise, For each of the neighbors...
for Pn
in NeighborPts:
### If Pn was labelled NOISE, claim it as part of cluster C
if labels[Pn] == -1
:
labels[Pn] = C
#Add Pn to cluster C
### Otherwise, if Pn hasn‘t been considered yet, claim it as part of
### C and add it to the search queue.
elif labels[Pn] ==
0:
labels[Pn] = C
#Add Pn to cluster C
SearchQueue.append(Pn)
#Add Pn to the SearchQueue
i += 1
#Advance to the next point in the queue.
return
def regionQuery(D, P, eps):
"""
Find all points in dataset `D` within distance `eps` of point `P`.
This function calculates the distance between a point P and every other
point in the dataset, and then returns only those points which are within a
threshold distance `eps`.
"""
neighbors =
[]
for Pn
in range(0, len(D)):
if numpy.linalg.norm(D[P] - D[Pn]) <
eps:
neighbors.append(Pn)
return neighbors
View Code
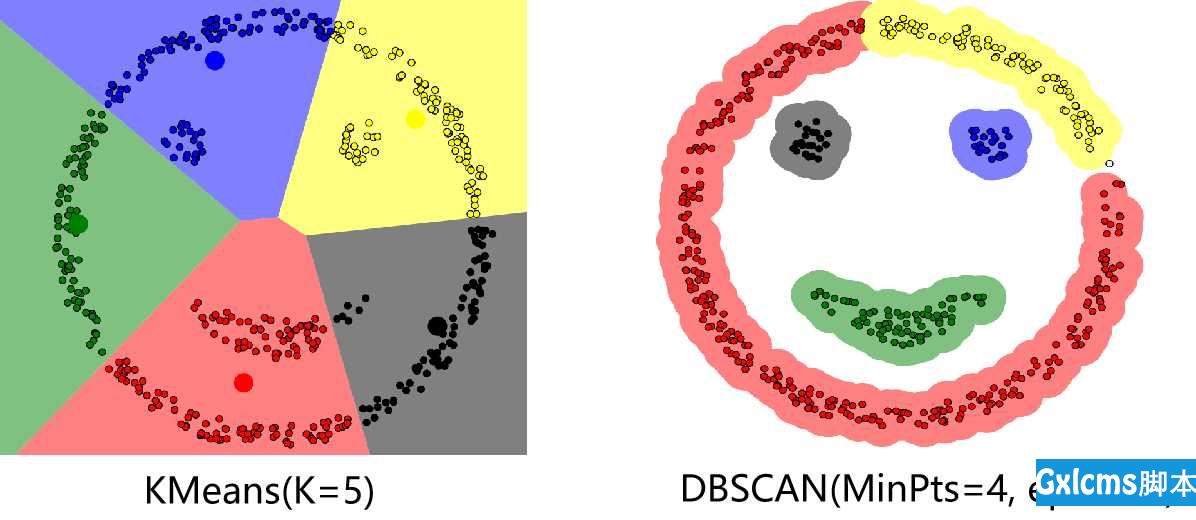
代码部分主要参考了文章DBSCAN Clustering Tutorial。若最终有数据点未被分到任何簇中(噪音点),则可将这些点视为异常点。下图分别是K均值算法以及DBSCAN算法对一个数据集的聚类结果,可以看出相比于K均值算法,DBSCAN算法可以有任意形状的簇,并且找到了数据中的异常点(右图中的空心点)。在实际应用中应对MinPts以及eps这两个参数仔细加以调试,特别是eps在不同的数据集中变化较大,具有较大的调试难度。
DBSCAN的一个改进算法为HDBSCAN,它也是一种基于密度的聚类方法,主要有两个参数$k$(也可记为$min\_samples$)以及$min\_cluster\_size$。DBSCAN通过一个数据点$\vec{x}$的半径为eps的邻域内是否有至少MinPts个点来判定该点是局地稠密还是稀疏的;而HDBSCAN通过一个数据点$\vec{x}$距它的第$k$个近邻点的距离$core_k(\vec{x})$来定量表征该点的局地密度,显然距离越大局地密度越小,在此基础上定义两个数据点之间的距离为:$$d(\vec{x}_1,\vec{x}_2)=\max{(core_k(\vec{x}_1),core_k(\vec{x}_2),\lVert{\vec{x}_1-\vec{x}_2}\rVert_2)}$$
- 以该距离为基础,建立如下面左图所示的Dendrogram树状结构图。该图等价于层次聚类中的single-linkage,即两个簇$X$和$Y$之间的距离可以表示为$d(X,Y)=\min\limits_{\vec{x}\in{X},\text{ }\vec{y}\in{Y}}d(\vec{x},\vec{y})$。
- 为了得到更稳健的聚类结果,HDBSCAN规定若每次分裂分出的两个新簇中有一个簇中的数据点个数小于$min\_cluster\_size$,则不进行这次分裂,只是将不满足要求的新簇中的点从之前的簇中移出,直到分裂出的两个新簇中的数据点个数均大于$min\_cluster\_size$再进行分裂,得到的结果如下图中的右图所示(簇的宽度表示簇中数据点的个数,簇的长度表征簇的存在周期。纵坐标$\lambda$定义为距离的倒数,即$\frac{1}{distance}$)。
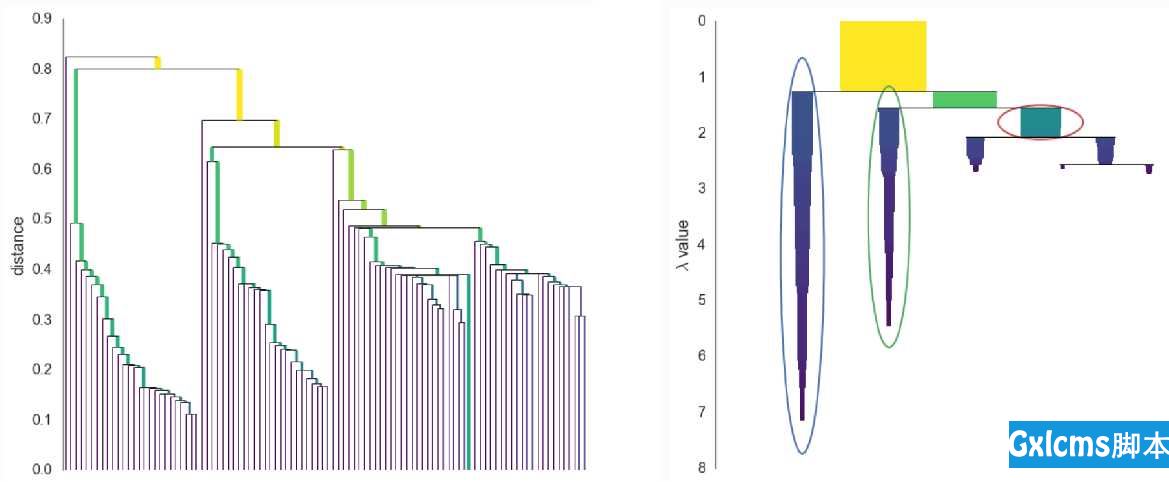
- 对任一个簇,将该簇的重要性定义为该簇在右图中所占面积。定义$\lambda_{birth}$为该簇生成时对应的$\lambda$,$\lambda_p$为该簇中的点$p$最后停留在该簇(即分裂到新簇之前或者被移出去之前)时对应的$\lambda$,则该簇的重要性用数学公式可表示为$\sum\limits_{p\in{cluster}}(\lambda_p-\lambda_{birth})$。
- 接下来还剩最后一个要解决的问题,即如何从右图的树状结构中选择最终的簇(右图中圈出的簇为最终选择的簇)。选择最终的簇的过程类似于决策树中的剪枝过程,从最底端开始,若两个子簇的重要性之和大于它们上一级的簇的重要性,则用这两个子簇以及它们的重要性之和代替它们上一级的簇以及上一级簇的重要性,否则删除这两个子簇,重复此过程直到最顶层,最终剩下的簇即为算法最终选择的簇。
- 同DBSCAN类似,最终未被分配到任何簇中的点可视为数据集中的异常点。HDBSCAN算法的主页为The HDBSCAN Clustering Library,一个较为详细的介绍视频链接为HDBSCAN, Fast Density Based Clustering, the How and the Why。
K均值聚类和DBSCAN介绍
标签:linkage image add 开始 desc fas 需要 sed wiki