时间:2021-07-01 10:21:17 帮助过:6人阅读
@目录
sql monitor是oracle官方提供的自动监控符合特定条件的SQL,用于收集执行时的细节信息的监控工具,常用于sql调优和系统性能监控
sql monitor 捕捉sql的前提:
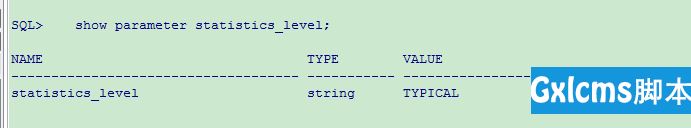
查看statistics_level参数
show parameter statistics_level;
建议还是改变Session就可以
alter session set statistics_level=ALL;
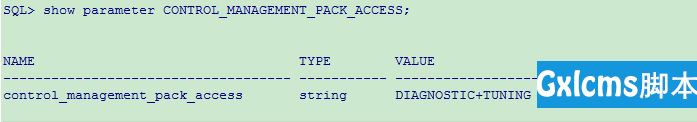
查看参数CONTROL_MANAGEMENT_PACK_ACCESS
show parameter CONTROL_MANAGEMENT_PACK_ACCESS;
本博客采用DBMS_SQLTUNE包DBMS_SQLTUNE.report_sql_monitor的方式获取,报告格式有:‘TEXT‘,‘HTML‘,‘XML‘ ,‘ACTIVE‘,其中‘ACTIVE‘只在11g R2以后才支持
sql monitor使用,必须在sql中使用/* +MONITOR*/ Hint,然后数据会存在v$sql_monitor表里
随意找条sql,注意要加/*+ moniotr*/
select /*+ moniotr*/ a.user_code, a.full_name, a.user_pwd, c.unit_code, c.unit_name
  from base_user a
  left join (select ur.user_code, ur.unit_code
               from t_user_role ur
              where ur.user_role < 10) b
    on a.user_code = b.user_code
  left join t_unit_info c
    on b.unit_code = c.unit_code
 where c.unit_code in
       (select uinfo.unit_code
          from t_unit_info uinfo
         start with uinfo.unit_code = ‘15803‘
        connect by prior uinfo.unit_code = uinfo.para_unit_code);
提供sql查询,获取sql_id
select sql_id,sql_text from v$sql_monitor where sql_text like ‘%t_unit_info%
将上面查询到的sql_id改下,然后执行如下SQL:
SET LONG 1000000
SET LONGCHUNKSIZE 1000000
SET LINESIZE 1000
SET PAGESIZE 0
SET TRIM ON
SET TRIMSPOOL ON
SET ECHO OFF
SET FEEDBACK OFF
spool report_sql_monitor_text.txt
SELECT DBMS_SQLTUNE.REPORT_SQL_MONITOR(
  SQL_ID => ‘g9rtj389t0g66‘,
  TYPE => ‘TEXT‘,
  REPORT_LEVEL => ‘ALL‘) AS REPORT
FROM dual;
spool off
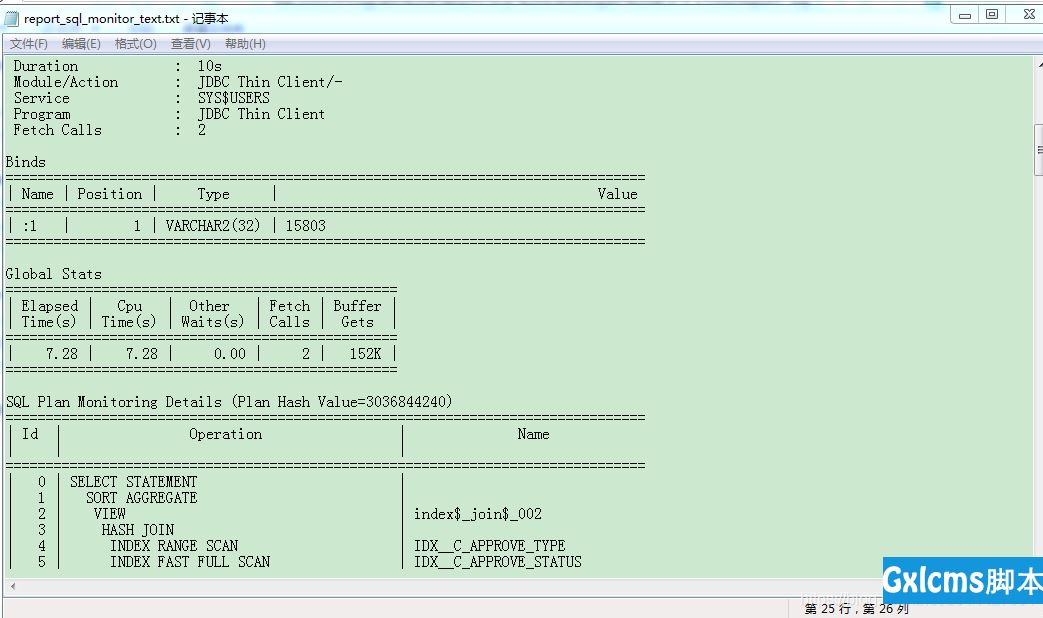
获取到text格式的sql monitor
SET LONG 1000000
SET LONGCHUNKSIZE 1000000
SET LINESIZE 1000
SET PAGESIZE 0
SET TRIM ON
SET TRIMSPOOL ON
SET ECHO OFF
SET FEEDBACK OFF
spool report_sql_monitor_html.html
SELECT DBMS_SQLTUNE.REPORT_SQL_MONITOR(
  SQL_ID => ‘g9rtj389t0g66‘,
  TYPE => ‘HTML‘,
  REPORT_LEVEL => ‘ALL‘) AS REPORT
FROM dual;
spool off
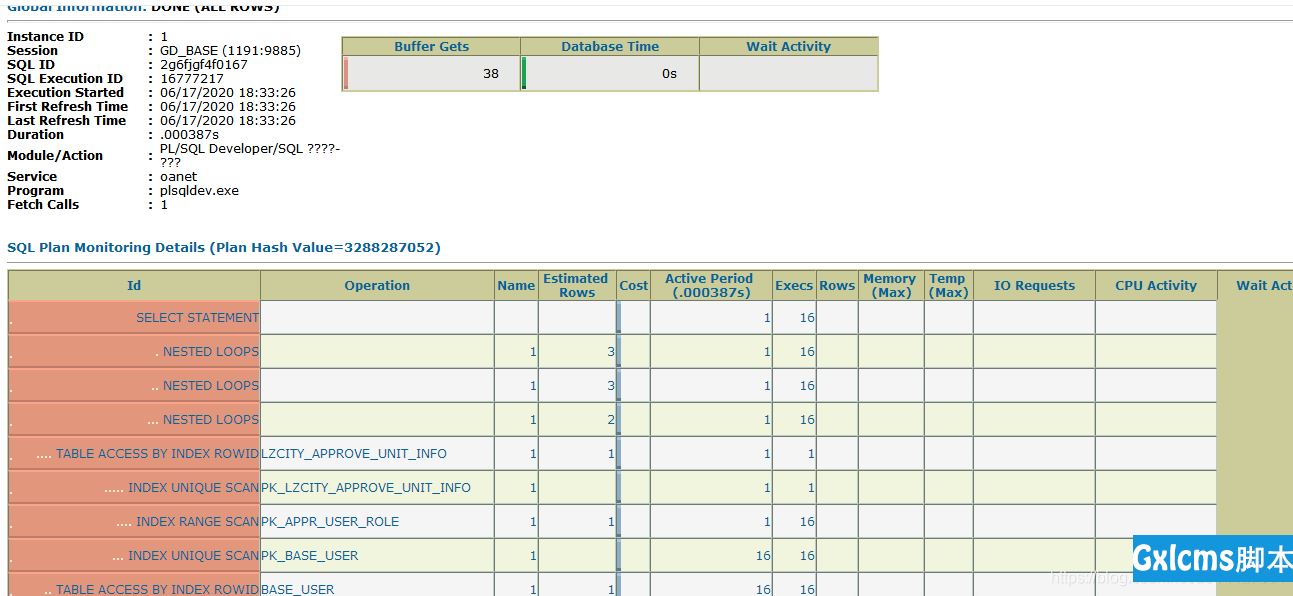
获取到对应报告,可以看到执行计划、Buffer Gets 等等信息
ACTIVE格式需要下载相应的flash组件、脚本,详细见SQL Monitor Report 使用详解
SET LONG 1000000
SET LONGCHUNKSIZE 1000000
SET LINESIZE 1000
SET PAGESIZE 0
SET TRIM ON
SET TRIMSPOOL ON
SET ECHO OFF
SET FEEDBACK OFF
spool report_sql_monitor_active.html
SELECT DBMS_SQLTUNE.REPORT_SQL_MONITOR(
  SQL_ID => ‘2rjh5d5k2yujz‘,
  TYPE => ‘ACTIVE‘,
  REPORT_LEVEL => ‘ALL‘,
  BASE_PATH => ‘http://ip/script‘) AS REPORT
FROM dual;
spool off
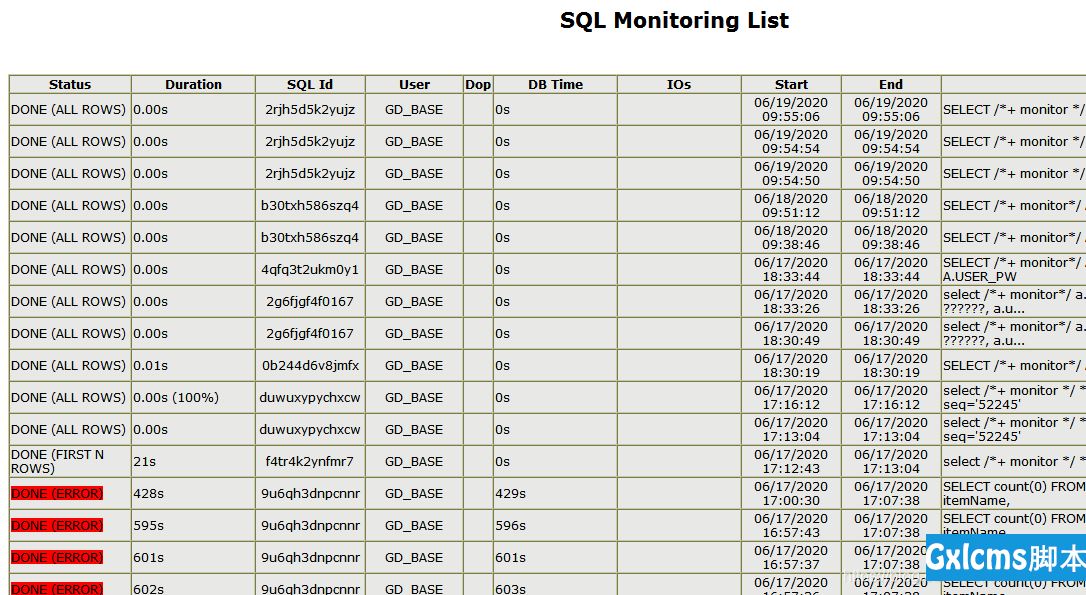
如果要获取所有sql monitor,就可以使用如下SQL:
SET LONG 1000000
SET LONGCHUNKSIZE 1000000
SET LINESIZE 1000
SET PAGESIZE 0
SET TRIM ON
SET TRIMSPOOL ON
SET ECHO OFF
SET FEEDBACK OFF
SPOOL report_sql_monitor_list.html
SELECT dbms_sqltune.report_sql_monitor_list(
  type         => ‘HTML‘,
  report_level => ‘ALL‘) AS report
FROM dual;
SPOOL OFF
提供sql monitor常用的查询脚本
select dbms_sqltune.report_sql_monitor from dual;
SELECT DBMS_SQLTUNE.report_sql_monitor(sql_id => ‘2rjh5d5k2yujz‘, type => ‘TEXT‘) from dual;
SELECT DBMS_SQLTUNE.report_sql_monitor_list(sql_id=>‘2rjh5d5k2yujz‘,type =>‘TEXT‘,report_level => ‘ALL‘) AS report FROM dual;
SELECT DBMS_SQLTUNE.report_sql_monitor_list(type =>‘TEXT‘,report_level => ‘ALL‘) AS report FROM dual;
相关SQL脚本下载:sql download
Oracle SQL调优系列之SQL Monitor Report
标签:dba lan color 自动 lis sql_id ffffff lines 系统